
















Texas Border Business




Texas Border Business
Comparing deportations under former President Barack Obama and President Donald Trump seems straightforward until you account for differences in federal definitions, agencies, reporting periods, and enforcement practices.
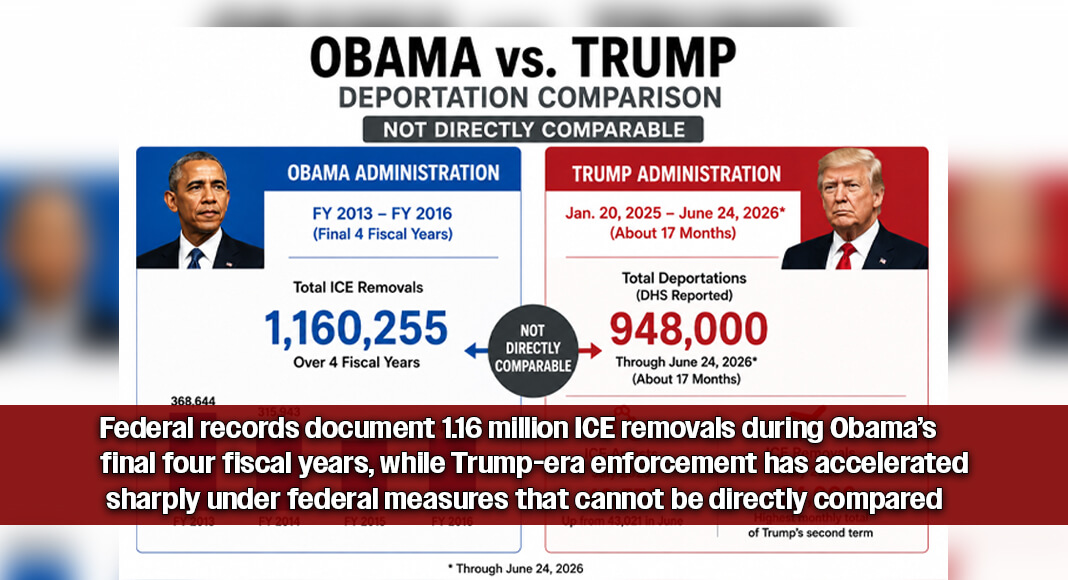
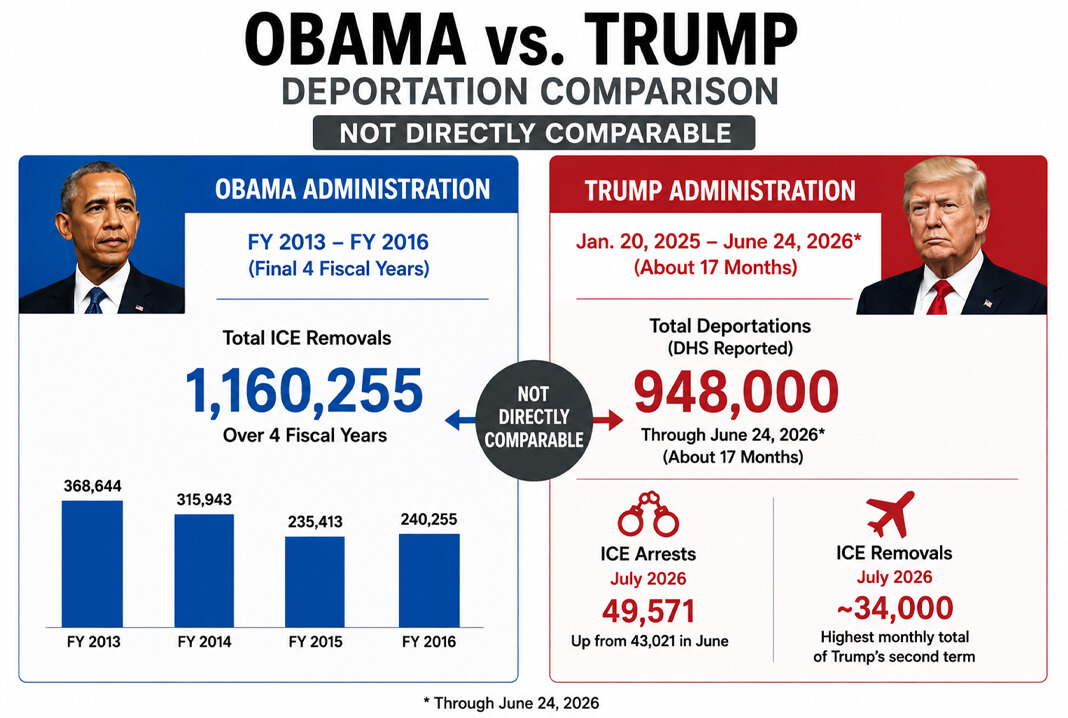
During Obama’s final four full fiscal years — fiscal years 2013 through 2016 — U.S. Immigration and Customs Enforcement recorded 1,160,255 removals, according to ICE records.




The annual totals were 368,644 in FY 2013, 315,943 in FY 2014, 235,413 in FY 2015, and 240,255 in FY 2016.
ICE defines a removal as the compulsory and confirmed departure of an inadmissible or deportable person based on an order of removal. Historical ICE removal statistics also included certain returns handled through the agency.
The Department of Homeland Security has said the Trump administration deported 948,000 people through June 24, 2026, following President Trump’s return to office in January 2025.
That number, however, should not be directly compared with Obama’s ICE removal totals.
Independent researchers have cautioned that publicly available ICE and U.S. Customs and Border Protection datasets cannot currently be combined into a reliable government-wide deportation total because some records may overlap.
The Deportation Data Project, an academic research initiative that obtains federal immigration records through public-records litigation, has said it does not have a reliable count of total deportations during Trump’s second administration. Researchers have explained that combining separate ICE and CBP datasets could potentially result in some individuals being counted twice.
Enforcement Has Accelerated
Available federal data nevertheless shows that immigration enforcement has accelerated during Trump’s current term.
Government data obtained by the Deportation Data Project shows ICE recorded 49,571 arrests in July 2026, up from 43,021 in June.
Nearly 34,000 removals occurred in July, according to reporting based on federal data, making it the highest monthly removal total of Trump’s second term to that point.
The composition of immigration enforcement has also changed.
During Obama’s later years, ICE increasingly concentrated interior enforcement on people with criminal convictions. In FY 2016, 92 percent of ICE interior removals involved people previously convicted of a crime, according to ICE.
Under Trump, enforcement has expanded substantially among immigrants already living inside the United States. Deportation Data Project researchers found that deportations following ICE arrests and detention were approximately five times higher in January 2026 than the average monthly level during the second half of 2024.
That finding does not mean total annual deportations increased fivefold. It specifically measures deportations following ICE arrests and detention during the periods examined.
The most defensible comparison, therefore, is not simply 1.16 million under Obama versus 948,000 under Trump.
Obama’s 1.16 million represents four full fiscal years of published ICE removal statistics. Trump’s 948,000 is a broader DHS-reported administration figure covering roughly 17 months, and its underlying methodology has not been publicly documented in comparable detail.
What can be established is that Obama’s final four fiscal years produced 1.16 million documented ICE removals, while immigration enforcement during Trump’s second term has accelerated sharply, particularly through arrests and removals involving people living in the interior of the United States.
Any direct numerical comparison should identify these methodological differences rather than treating the two totals as equivalent measurements.
Disclosure: This comparison is based on the most reliable federal data and publicly reported figures available at the time of publication. The findings are not conclusive because federal agencies have used different definitions, reporting periods, and methodologies for immigration removals and deportations. Some datasets may overlap or may not be directly comparable across administrations. Texas Border Business presents these figures for informational purposes and will update them as more complete federal data becomes available.
See related stories: