


Texas Border Business


AUSTIN, Texas – The following is an analysis by Texas Oil & Natural Gas Association (TXOGA) Chief Economist Dean Foreman, Ph.D.:
ith strong population and economic growth–plus the arrival of hot weather–Texas’ electricity markets are on pace for record-high demand and electricity to be delivered this summer.
The scorekeeping for this summer’s Texas heat and electricity generation milestones so far (for example see here and here–including some new record highs in Texas) raises questions about why we have seen such strong summer demand, when much of the U.S. has experienced a hot summer yet lower electricity loads, per the U.S. Energy Information Administration (EIA). Some sources have misleadingly suggested that wind and solar have propped up the grid while natural gas has underperformed in Texas.


The plain facts, however, are that natural gas, wind, and solar have each contributed more Texas power generation so far this summer–including greater shares for natural gas during late night and early morning hours per the EIA.
In the first seven weeks of summer 2023 (that is, June 21–August 7), the Electricity Reliability Council of Texas (ERCOT) power grid generated 6.3% year-on-year (y/y) more energy than it did in the same period last summer.
By energy source, ERCOT’s natural gas-based generation increased by 5.3% y/y and drove half–a daily average of 769,808 megawatt-hours (MWh) or 49.6% of total generation to be precise—of the grid’s total electricity generation, again per the EIA. Over the same period, ERCOT’s wind generation increased by 11.8% y/y to an average of 315,848 MWh (20.4% of total generation). Solar generation rose by 32.9% y/y to an average of 126,194 MWh (8.1% of total generation). Meanwhile, the contributions to generation coming from coal, nuclear, and hydro generation have fallen year-on-year so far this summer.
With half of the generation and increased amounts coming from natural gas, this underscores why natural gas remains the backbone of the ERCOT power grid and is indispensable in powering modern life. Policies that promote both a reliable and affordable power grid are therefore key to Texans’ everyday lives and fueling the economy.
Q: Are Texas’ electricity generation trends historically much different than the U.S. overall?A: Yes, Texas’ electricity generation has grown four times faster–that is, 2.0% per year between 2012 and 2022, compared with nationwide growth of 0.5% per year, per the EIA. As shown below, Texas’ net generation for all sectors increased to 524.5 million MWh in 2022 from 429.8 million MWh in 2012. This means that Texas has seen tremendous expansions in its need for electricity generation.
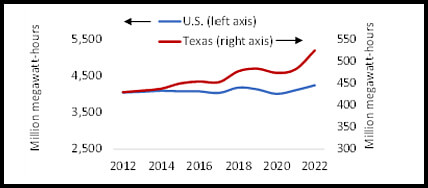
U.S. and Texas net electricity generation, annual averages, 2012-2022 (EIA)
Q: What has happened in the first seven weeks of summer 2023?
A: Despite headlines about a summer heatwave, U.S. electricity generation needs so far this summer–June 21 to August 7–have been 0.7% y/y lower than they were over the same period in 2022, per EIA. To compare this summer so far with last summer, consider charts of daily net generation, indexed so that June 21, 2022, equals a value of 100 for the U.S. lower 48 states on the left and for Texas on the right, based on EIA data. In the left panel, it is evident that the nationwide load was below last year’s levels until the last week of July.
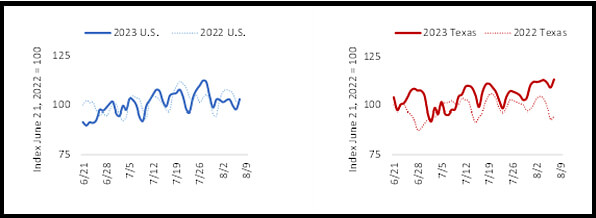
Summer comparisons: U.S. and ERCOT daily net electricity generation,
indexed June 21, 2022=100
Focusing on the ERCOT region for Texas in the right panel, net generation exceeded its levels of a year ago in 42 or the past 48 days and was above last summer’s levels by an average of 6.3% y/y.
Q: Is the increase in Texas’ electricity generation just a reflection of increased summer heat and air conditioning demand?
A: Actually, in addition to higher temperatures so far this summer, underlying demographic and economic growth have also contributed to Texas’ electricity load.
Although the National Oceanic and Atmospheric Administration’s (NOAA) reports of statewide average temperatures are not yet available, consider daily data from specific weather stations as a directional gauge. With the Houston area, for example, average temperatures on an hourly-weighted basis averaged 86.4°F between June 21 and August 7, compared with 85.5°F over the same period last summer, which represents a 1.1% y/y increase.
The relationship between temperature and electricity demand tends to be non-linear, with greater cooling needs as temperatures rise, so if this increase was representative of changes across the ERCOT region then it generally would correspond with a load increase of 2.7% or less–about 40% of the 6.3% y/y increase that ERCOT has experienced so far this summer.
If this temperature comparison for Houston is indicative of statewide patterns, hotter temperatures accounted for about 40% of the increased electricity generation this summer, which means that Texas’ demographic and economic growth accounted for the other roughly 60%.
Understanding the relative importance of demographic and economic drivers holds implications for policy and industry since adding people and economic activity in the state has historically been an enduring source of growth.
Q: What stands out about ERCOT’s mix of generation sources compared with the U.S. overall?
A: In the first seven weeks of summer this year, Texas received an average of 49.6% of its electricity from natural gas, compared with 44.6% nationwide. Texas generated another 20.4% of its electricity from wind, versus 7.3% nationwide. These percentages vary by the day, depending on the weather, and for the year as of August 7, natural gas provided 53% of Texas’ electricity per EIA.

Q: What about ERCOT’s generation and capacity by energy source has changed since last year?
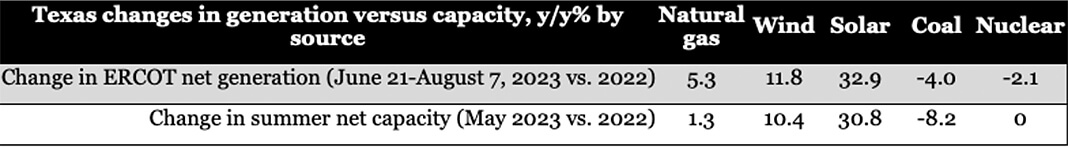
A: The generation increases have mainly been driven by changes in capacity and the weather. Considering the following comparisons of percentage changes y/y in ERCOT’s generation and summer net capacity:
The increases in net generation and summer capacity are of relatively similar magnitudes but suggest greater utilization of natural gas, wind and solar over the period of June 21 to August 7, 2023. Coal generation fell by less than coal-based generation capacity, so the utilization of remaining plants increased. By contrast, nuclear-based generation fell less despite no capacity change per EIA.
For wind and solar, the summer 2023 increases in generation indicate that weather also contributed to the changes. For wind, the difference–that is, a 11.8% y/y increase in generation compared with a 10.4% y/y increase in capacity–suggests that it has been windier so far this summer. In Corpus Christi for example, the average wind speed so far this summer has been 11.8 miles per hour (mph), compared with 11.1 mph last summer, which is a 6.4% y/y increase. However, this apparently was not the case everywhere in Texas. For example, the Houston area’s average wind speed rose by 1.8% y/y to 8.4 mph over the same period.
Q: How has the utilization of different energy sources changed across times of the day?
Consider the following comparison by hour of the day this summer, compared with last summer, based on EIA data.
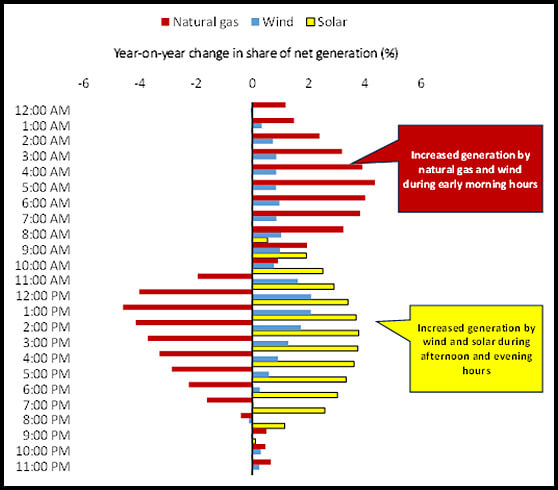
ERCOT changes in shares of electricity generation by hour, June 21-August 7, 2023 vs. 2022
Charting the changes since last summer in ERCOT’s shares of electricity generation provided by natural gas, wind and solar over the course of each day, we see that on average natural gas has provided a greater portion of generation between 9:00 PM and 10:00 AM, but less at other times.
By comparison, wind generation has increased across most of the day, but especially in the early afternoon. A difference between this summer and other recent summers has been that, even in the early afternoon hours when wind output is typically low, wind generation this summer has been relatively robust. And solar has increased the most in mid-afternoon hours, when the sun is most intense, but also has been evident in the evening hours, which could be related to improved tracking systems with new solar capacity additions.
As wind and solar became a greater share of the mix during the afternoon and evening hours, it backed out natural gas, which intuitively reinforces the order in which generation resources are dispatched in the ERCOT wholesale market. Since wind and solar do not entail fuel costs, it is the most economic to utilize them first. At hours when it is not windy or sunny, however, natural gas has continually proven to be an economic source, again contributing nearly half of total generation so far this summer.
To summarize, although seasonal weather, demographics, and economic growth each influence generation, it appears that ERCOT’s capacity additions have had the greatest impact on its generation mix since last year.
Despite the sizeable additions of wind and solar capacity, however, natural gas has still increased and contributed a greater share of total generation during the early morning hours. The timing of these natural gas generation increases could reflect the need for it, or since we have generally seen ERCOT’s reserves increase in early morning hours, it also is possible that the generation has been made available in advance of the need for it. Either way, it shows the indispensable role of natural gas in ERCOT’s grid and in powering Texas.