


Robert C. Vackar College of Business & Entrepreneurship

Texas Border Business


by Salvador Contreras and Rogelio Sáenz
The last couple of months have brought major devastation to the nation’s workforce. The employment debacle is apparent in the Bureau of Labor Statistics (BLS) recently released employment figures for April. The BLS report showed that the US unemployment rate rose from 4.4% in March to 14.7% in April. The tripling of the unemployment rate was driven by job losses in practically all industries. Stay-at-home orders saw teachers, cashiers, machine operators, dishwashers, dentists, and many others lose their sources of income. While at the end of February there were 2 million persons who filed continued claims for unemployment insurance, the total shot up to 22 million by the end of April. In Texas, the volume of continued claims soared nearly nine-fold from 125,000 to 1.1 million in the same time period.
In this issue we focus on April’s toll on Texas. Given the gravity of the situation and the need for targeted policy response, we analyze the April 2020 Current Population Survey (CPS) to understand who has been affected and to what degree. We show that no group has been spared, as every group and most industries were negatively impacted.


However, there are important differences to note. Black and Hispanic Texans saw larger declines in employment when compared to Whites. Women saw almost twice the declines in employment versus men. In particular, Black and Hispanic women saw the largest declines. Further, Texas’ younger workers alongside those with lower levels of education and income experienced the most severe employment declines.
We show that the Rio Grande Valley had the largest percent decline in employment among large Texas metros. However, the data suggest that when official unemployment figures come out, the Houston metro will have the state’s highest jobless rate, followed by the Rio Grande Valley. An interesting side note is that in our Fall 2019 issue, we show that these two metros had the state’s highest level of income inequality.
Texas employment
The Bureau of Labor Statistics uses the Current Population Survey (CPS, a household survey) and the Current Employment Statistics survey (a business establishment survey) to construct its monthly employment report. Here, we only use the former—the CPS household survey. In addition, there is no attempt to adjust for seasonal factors or other noise in the data. The reader should use caution in reading too much into levels, particularly when the unit of analysis is small, like metros. Instead, the reader should focus more on drawing conclusions from relative differences. We use the CPS data extracted from the Integrated Public Use Microdata Series.1
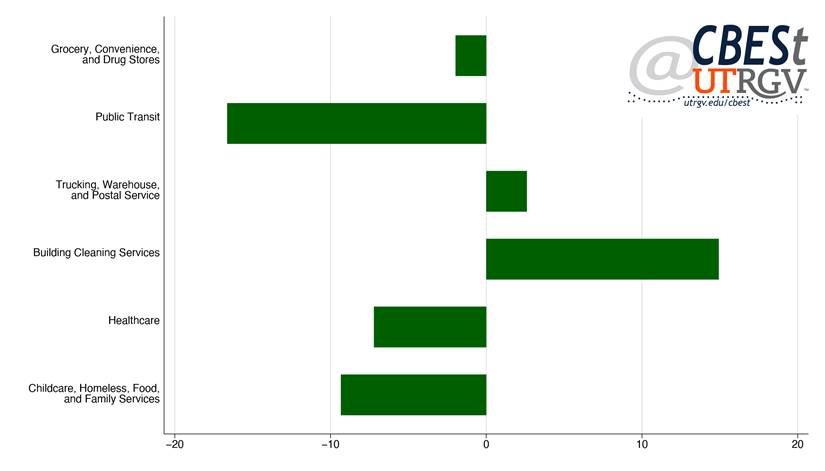
Figure 1: Texas frontline industry employment change, March to April 2020
Source: Current Population Survey
Figure 1 presents the percent change in April 2020 employment compared to the previous month (March 2020) for Texas. We first present employment trends for frontline workers. We draw here on a recent report from researchers at Center for Economic and Policy Research (CEPR) that provides a demographic profile of frontline industries in the COVID-19 pandemic.2 These industries include supermarket stockers, nurses, farmworkers, truck drivers, among others. We use the CEPR studies’ industry definitions and present the six broad categories that represent frontline workers.
In Texas, over the last month—March to April 2020—employment declined in three frontline industrial sectors: public transit; healthcare; and childcare, homeless, food, and family services employment. While seeing gains in building cleaning services. Overall, Texas saw a loss of upwards of 91,000 frontline industry jobs, fueled by losses of 87,000 jobs in healthcare and 19,000 in childcare, homeless, food, and family services. On this front, Texas did better, the US saw a 9% drop in frontline employment compared to Texas 4%.
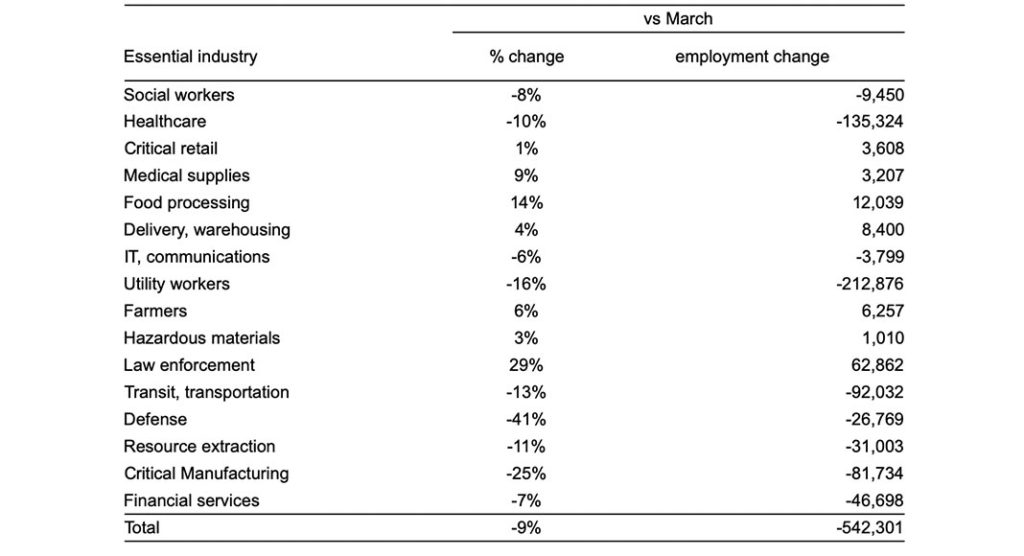
Table 1: Texas essential industry employment change, March to April 2020
Source: Current Population Survey
Table 1 presents employment in essential industries. These are broader than frontline industries in that it includes other non-consumer facing industries such as resource extraction, food and drug manufacturing. In a recent report Adie Tomer and Joseph W. Kane from Brookings describe the Department of Homeland Security (DHS) designated list of essential infrastructure workers.3 We follow the Brookings report in constructing these essential industries. Table 1 shows across-the-board losses in employment in Texas. However, the largest job declines over the last month in Texas occurred in four industries: utilities (-213,000), health care (-135,000), transportation (-92,000), and critical manufacturing (-82,000). Other industries taking major hits in employment include the financial services (-47,000), resource extraction (-31,000), and defense (-27,000) industries. Overall, Texas lost more than half a million essential industry jobs.
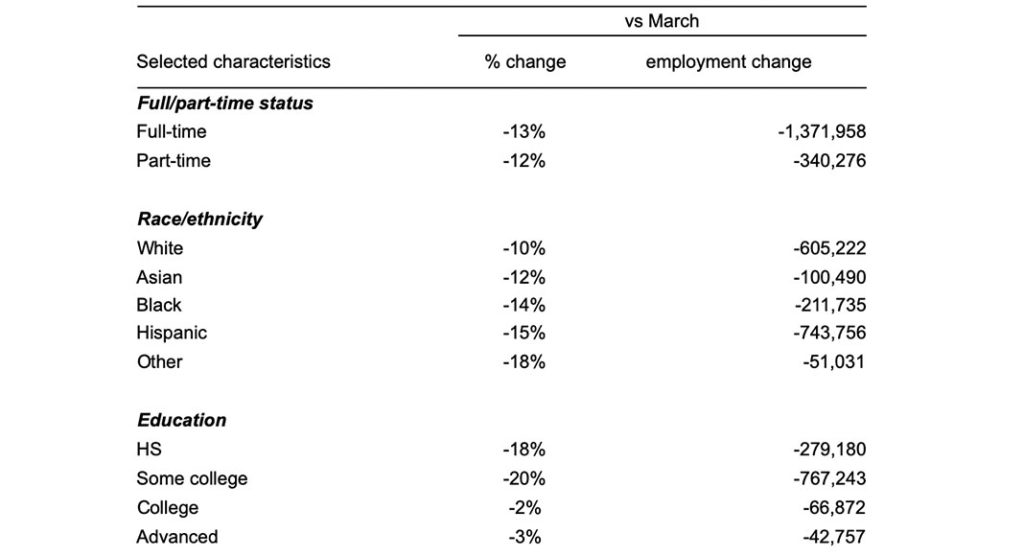
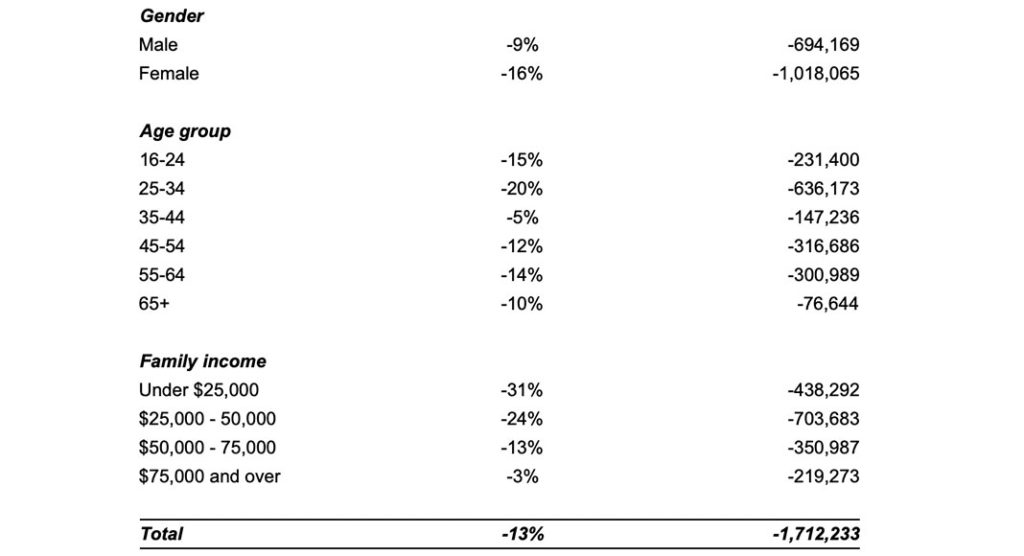
Table 2: Texas employment change, selected characteristics, March to April, 2020
Source: Current Population Survey
Table 2 examines six characteristics of all Texas workers and the extent to which their employment has been affected more directly by the Covid-19 outbreak over the last month. The analysis shows that the state’s full-time and part-time workers have been hit at a similar level (13% and 12%, respectively). Among the state’s racial and ethnic groups, Hispanic (-744,000), White (-605,000), and Black (-212,000) workers have lost the largest number of jobs over the last month. However, in a relative sense, Hispanics (-15%) and Blacks (-14%) have lost jobs at a faster rate than Whites (-10%) and Asians (-12%). Furthermore, job losses are almost exclusively concentrated among workers with a high school degree (or less) and some college (including vocational and Associate’s degrees). Similarly, women (-16%) lost their jobs at almost twice the rate of that of men (-9%) between March and April. Moreover, while nationally the young and old saw the largest employment declines, in Texas the declines were broadly shared across age groups. However, 25-34-year-olds saw employment decline by nearly 640,000 between March and April. Finally, the table shows that employment losses were more prevalent in poorer households (under $25,000, -31% job loss; and $25,000-$49,999, -24%). As a whole, then, Texas lost slightly more than 1.7 million jobs, at a clip of 13%, between March and April.
Racial/ethnic differences
Next, we tease out differences by race/ethnicity. Figure 2 shows statewide employment change by race and a broader measure of industry. We use a broader industry because some groups may not be properly captured by a narrower category of industry. The analysis shows that declines in manufacturing were mostly observed among Blacks and Hispanics, losing a combined 116,000 jobs or a decline of 43% and 18%, respectively. Whites had the largest employment losses in retail and wholesale and services. Overall, Hispanics were on the net the largest employment losers in April, dropping three-quarters of a million jobs.
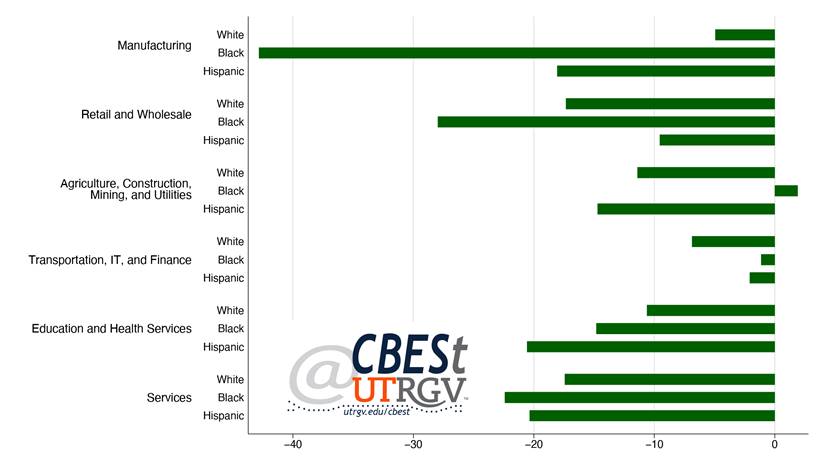
Figure 2: Texas employment change for broad industries by race, March to April 2020
Source: Current Population Survey
Females saw declines twice as large as males. Hispanic women in particular saw a 21% decline in employment. Figure 3 shows employment change of males and females by education and race. White women and Black men with a high school education or less had the largest percent declines in employment. However, the largest level of job declines was among those with some college education. Hispanic and Black women with some college saw a quarter of their jobs eliminated. Finally, Hispanic men and women experienced the highest declines in employment among those with a college degree. This is in contrast to Table 2 that shows that in general this group suffered the least.
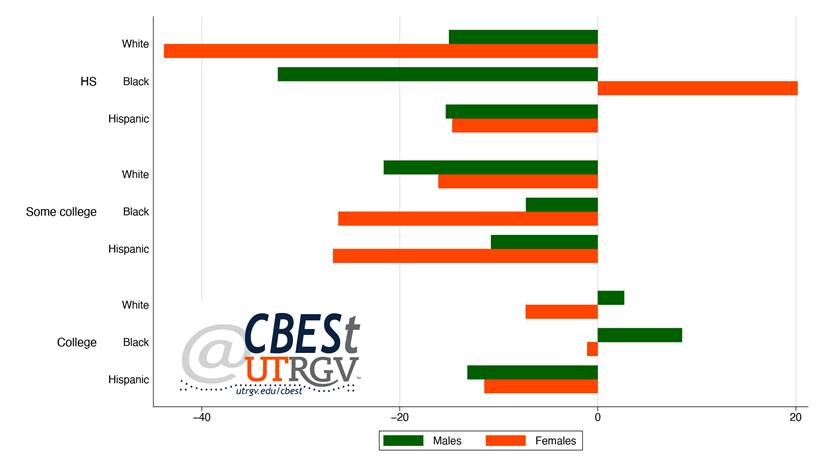
Figure 3: Texas employment change by sex, race and education, March to April 2020
Source: Current Population Survey
Regional differences
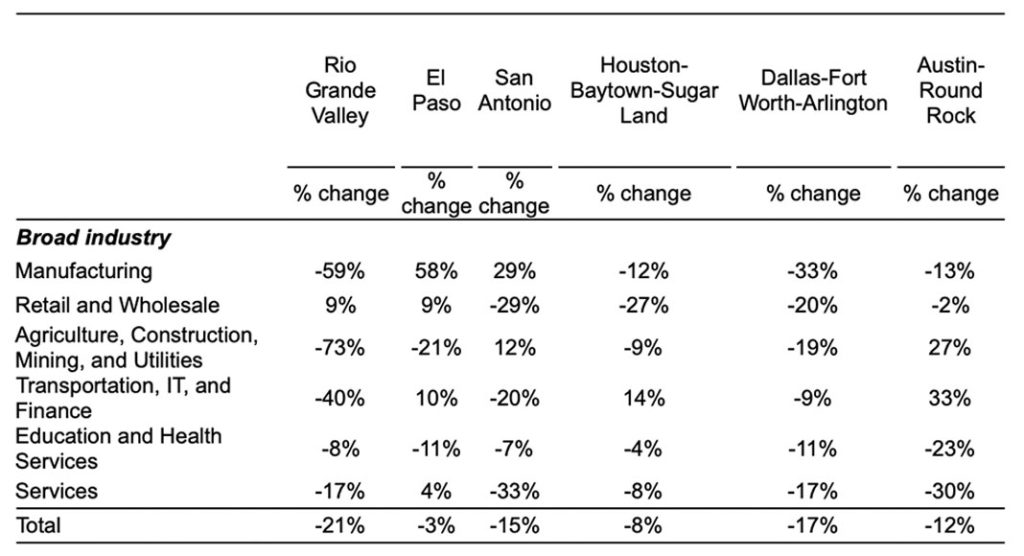
Table 3 presents March-to-April change in employment for selected Texas metros. The Rio Grande Valley (Cameron and Hidalgo County) sustained the largest percentage decline in employment, losing a little bit over one-fifth (-21%) of workers in the last month. The Rio Grande Valley lost jobs in every broad industry category except retail and wholesale. The Rio Grande Valley experienced the largest declines in construction, mining, and utilities (-73%), manufacturing (-59%), transportation, IT, and finance (-40%), and services (-17%). El Paso, on the other hand, saw an increase of 58% in manufacturing. A bit of background on the differences in these two border areas: the Rio Grande Valley saw a decline of 59% in manufacturing, but manufacturing is two times the share of El Paso employment compared to the Rio Grande Valley (see our Winter 2019 issue). The increase in this sector plus retail and wholesale and transportation, IT, and finance helps to explain the relatively small effect in El Paso’s total employment loss.
Table 3: April 2020 one-month change in employment, selected metros
Source: Current Population Survey
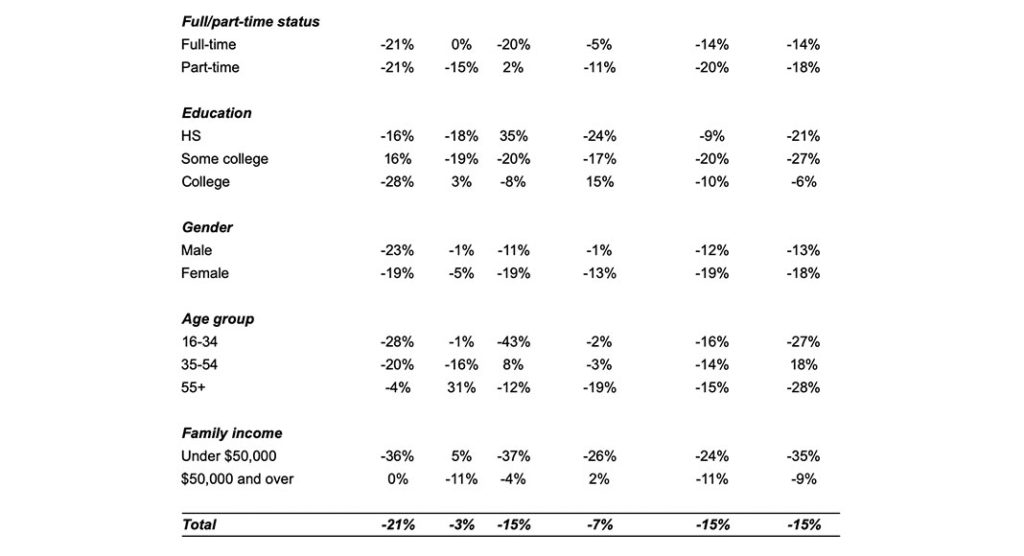
Further, most jobs lost in El Paso are predominantly among part-time workers. However, in the Rio Grande Valley, one in five full-time and part-time employees became separated from their job. Still, overall across metro areas, part-time workers were the hardest hit, except in San Antonio.
While employment loss appears to be uniform across education levels, it is interesting to note that the highly educated in the Rio Grande Valley saw the largest declines in employment. This is consistent with our Spring 2020 issue that shows that young high-skilled workers in the Rio Grande Valley are under-employed/paid and, therefore, far more vulnerable to economic shocks.
All metros saw women suffer more job loss compared to men, except in the Rio Grande Valley. Women in El Paso and Houston, in particular, sustained almost all job losses between March and April 2020. Across metro areas, younger workers fared worse. A notable exception is Houston where persons 55 and older accounted for most of the job declines. Finally, those who lost their jobs in April were disproportionately among people with family incomes less than $50,000, with El Paso being the exception. Overall, the Rio Grande Valley saw a 21% decline in employment followed by Dallas-Fort Worth-Arlington (-17%), San Antonio (-15%), and Austin-Round Rock (-12%).
Figure 4 shows the unemployment rate for March and April in the selected metros. As noted earlier, these figures are different from what is reported in the official employment numbers. This rate likely over-estimates the true rate by around 1%. For example, the official non-adjusted Houston metro March rate is 5.1% compared to our 6.2% estimate. However, it provides some perspective on the economic fallout of this crisis. The data suggest that the Houston metro will likely have the highest unemployment rate of 16.3%, compared to 6.2% in March. The Rio Grande Valley is expected to have the second-highest unemployment rate, followed by Austin and San Antonio. El Paso is expected to have the lowest unemployment rate at around 10%.
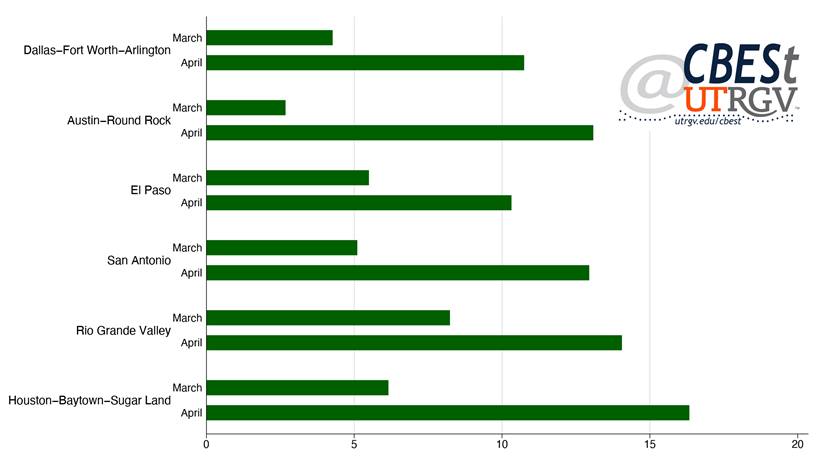
Figure 4: Unemployment rate, selected metros, March and April 2020
Source: Current Population Survey
Summary
We presented statistics that provide an indication that Texas was not spared from the job carnage seen across the nation. The recent Bureau of Labor Statistics report shows that Texas had an unemployment rate of 12.8% and a loss of 2 million jobs in April. Texas saw declines in employment that are consistent with national trends. However, in Texas, job losses have not been uniform. People who have disproportionately lost their jobs include people of color (Blacks and Hispanics), women, people with lower levels of education, and people with the lowest income levels. The employment reports that will be coming out in the coming months are likely to disappoint those who expect a quick recovery of lost jobs. After all, weekly jobless claims continue to suggest high job losses, albeit a declining trend. The Commerce Department reported a decline in retail sales of 16.4% for April and the Federal Reserve reported an April contraction in industrial production of 11.2%. Things are likely to remain bleak for, most optimistically, a few more months, but, more realistically, years into the future. In the meantime, Texas must come to grips with the human toll and its disproportionate impact on its most vulnerable people.
Dr. Salvador Contreras is Associate Professor of Economics at the University of Texas Rio Grande Valley
Dr. Rogelio Sáenz is Professor of Demography at the University of Texas San Antonio
Endnotes
1. Flood, S., King, M., Rodgers, R., Ruggles, S., and Warren, J. R. (2020). Integrated Public Use Microdata Series, Current Population Survey: Version 7.0 [dataset]. Minneapolis, MN: IPUMS. https://doi.org/10.18128/D030.V7.0
2. Rho, H. J., Brown, H. and Fremstad, S. (April 2020). A Basic Demographic Profile of Workers in Frontline Industries. Center for Economic and Policy Research. Retrieved from https://cepr.net/a-basic-demographic-profile-of-workers-in-frontline-industries/
3. Tomer, A. and Kane, J. W. (March 2020). How to protect essential workers during COVID-19. Brookings. Retrieved from https://www.brookings.edu/research/how-to-protect-essential-workers-during-covid-19/
| Center for Border Economic Studies |
| Robert C. Vackar College of Business & Entrepreneurship The University of Texas Rio Grande Valley 1201 W. University Drive, Edinburg, TX 78539 cbest@utrgv.edu |