


U.S CENSUS BUREAU – All age groups in the South grew faster than in any other region from 2020 to 2025, primarily fueled by outlying metro counties, according to new Vintage 2025 estimates released by the U.S. Census Bureau.


Many counties across the country saw slower growth in the past year, but those in the South were less affected. In fact, the region has had most of the nation’s fastest‑growing counties every year since 2020.
New data released today for all counties in the United States and Puerto Rico provide a closer look at what age groups were driving the growth of U.S. counties across different stages of life: childhood (0-17), young adulthood and higher education (18-24), early work and family-building years (25-44), midlife (45-64), and retirement (65 and older).
“Regional age patterns are changing for a few key reasons,” said Lauren Bowers, chief of the Census Bureau’s Population Estimates branch. “The continued transition of baby boomers into retirement age, compounded by local migration and fertility patterns, is shifting the demographic makeup of the country. The South stands out because it is seeing population gains in age groups that in other regions saw little change or are declining, reflecting its strong positive migration patterns this decade.”


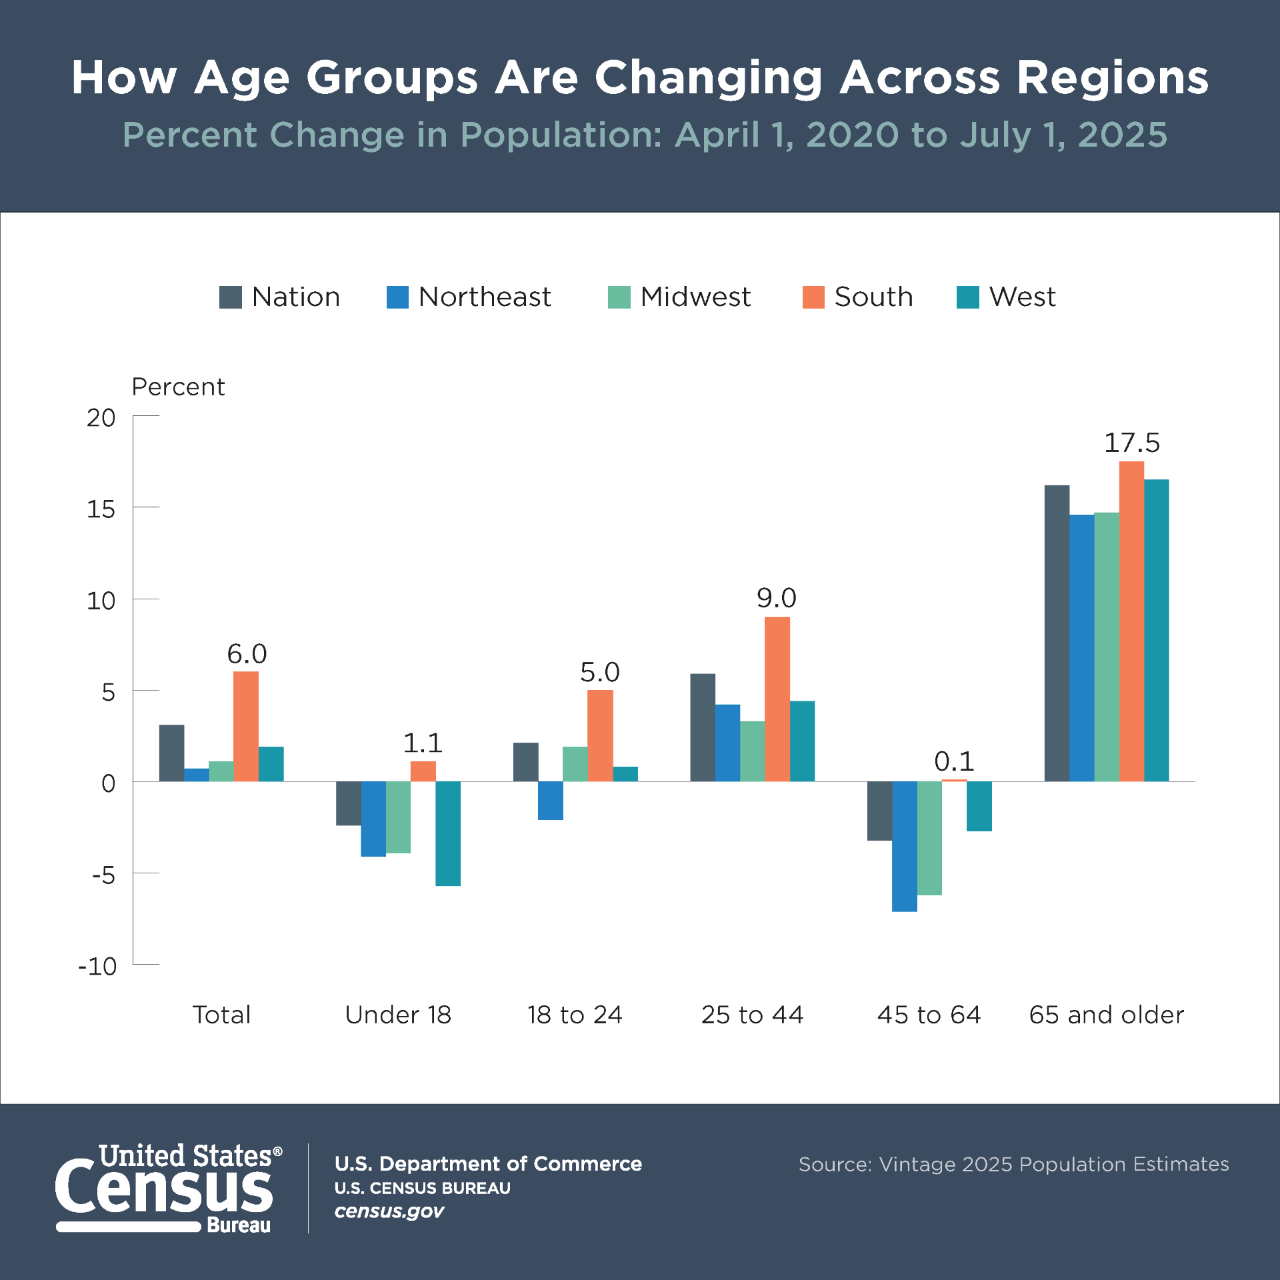
Between April 1, 2020, and July 1, 2025, the South grew by 6.0%, nearly double the nation’s 3.1% population growth. It was the only region to see population growth in all five age groups, outpacing the other regions within each age group.
Notably, the South was the only region whose population under 18 grew from 2020 to 2025; its growth of 1.1% contrasted with declines for the Northeast (-4.1%), Midwest (-3.9%), and West (-5.7%).
Similarly, it was the only region whose 45-64 population grew over the five-year period, although just barely; its growth of 0.1% (about 19,000) stood apart from the modest declines of the Northeast (-7.1%), Midwest (-6.2%), and West (-2.7%).
In contrast, the West had the largest percentage decrease in the population under 18 (-5.7%), and the Northeast was the only region to lose young adult (18-24) population (-2.1%). The Northeast also had the fastest decline among ages 45-64 (-7.1%) and the slowest growth among those age 65 and older (14.6%).
Metro Counties — Particularly Outlying Counties — Drove the South’s Growth
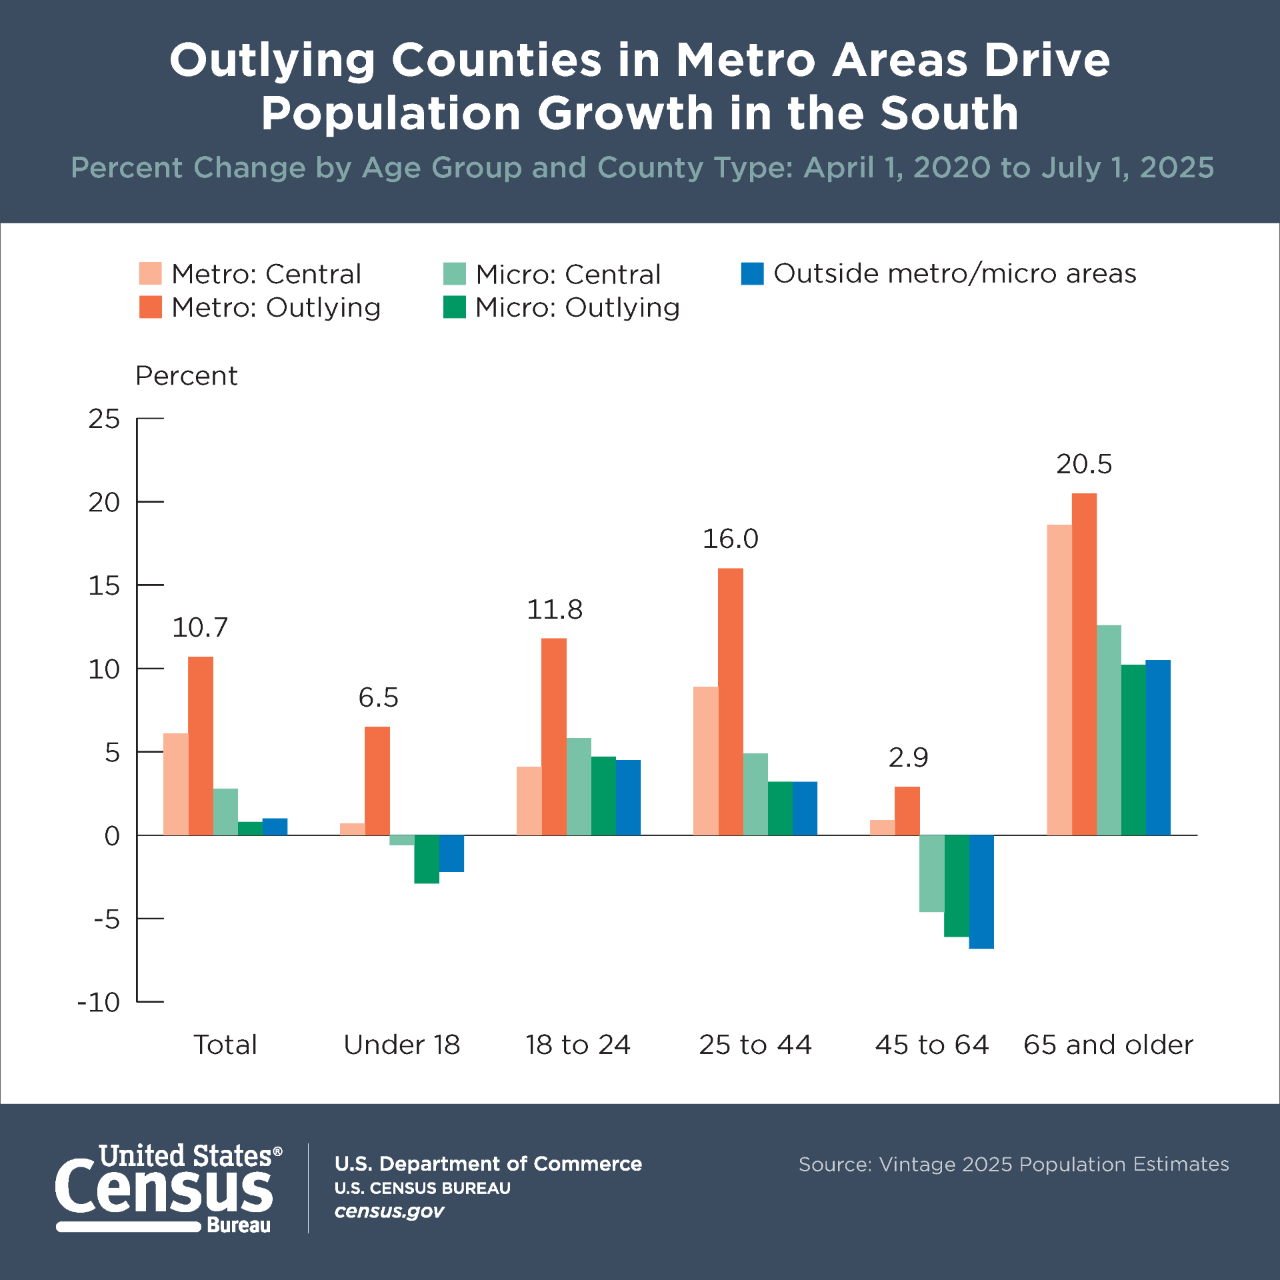
Looking at population change for the nation’s metro and micro areas by region, it is clear where the South had its strongest growth: metro counties grew by 6.7%, while the next largest growth — across all regions and county types — was in micro counties (2.7%).
Metro counties in the South were also the only counties to see growth between 2020 and 2025 for the populations ages 0-17 and 45-64. Plus, they had the fastest growth for 25- to 44-year-olds and the 65-and-older population.
Meanwhile, it was the metro outlying counties in the South that grew the fastest.
“The South’s growth from 2020 to 2025 has been particularly prominent in its metro areas’ outlying counties,” added Bowers. “These outlying counties grew the fastest across all age groups, and often by a large margin, suggesting that they are attracting or retaining — likely some combination of both — people of all ages.”
These patterns provide more evidence that growth in metro areas since 2020 has largely been in the exurban areas on their outer edges.
- Table 3. Population and Population Change by County Type and Age Group: 2020 to 2025: Northeast Region
- Table 4. Population and Population Change by County Type and Age Group: 2020 to 2025: Midwest Region
- Table 5. Population and Population Change by County Type and Age Group: 2020 to 2025: South Region
- Table 6. Population and Population Change by County Type and Age Group: 2020 to 2025: West Region
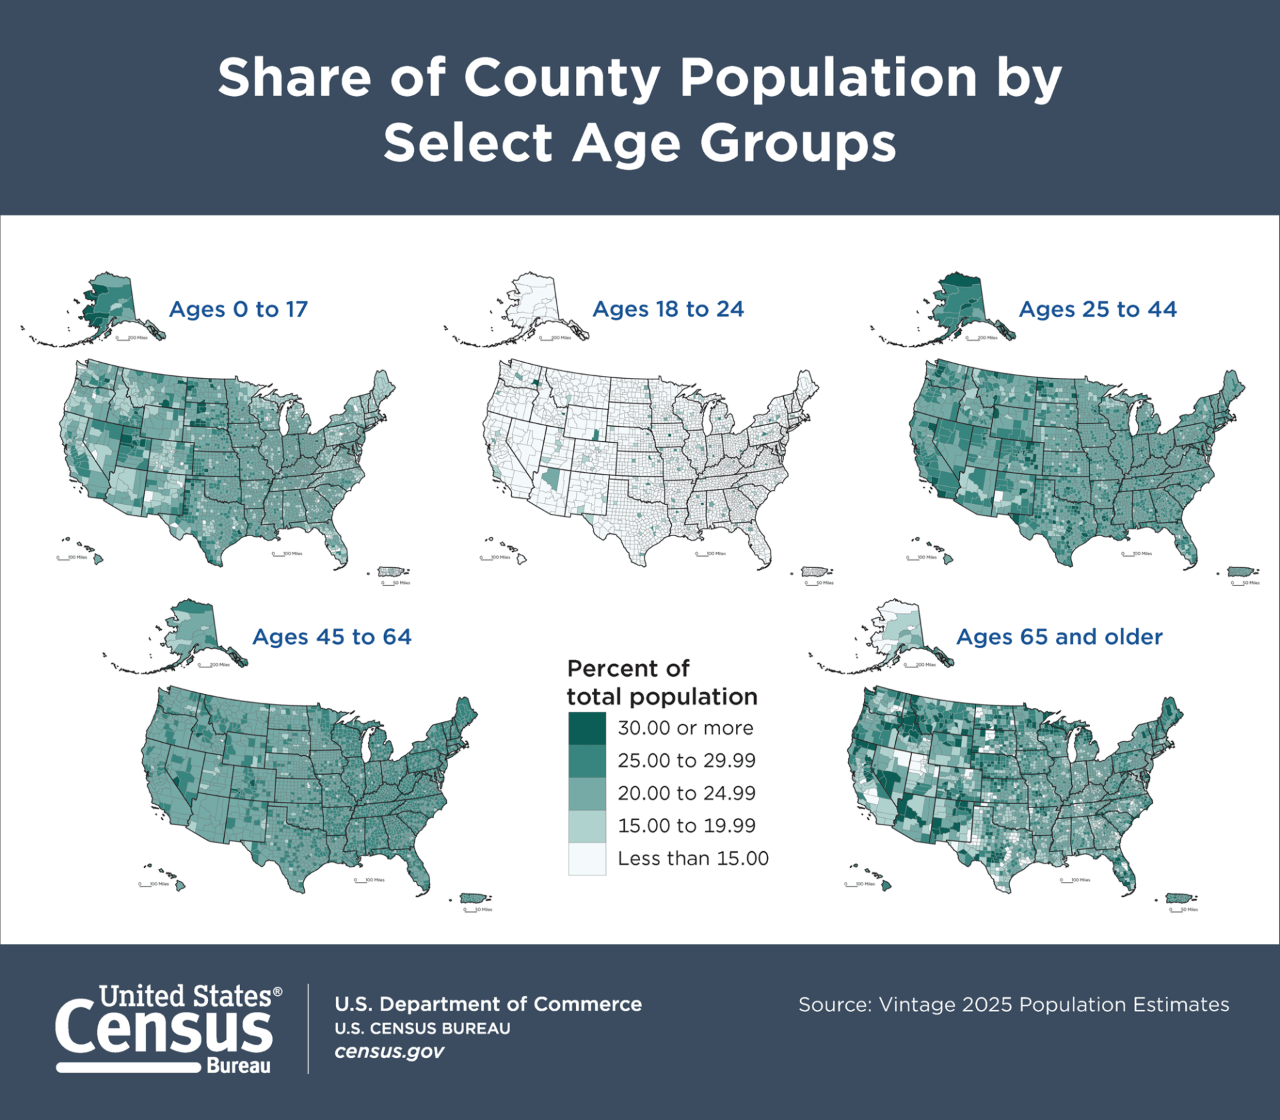
Geographic Variation by Age
In addition to the population’s age composition shifting, there was significant variation in 2025 regarding where each group had its largest share (or percent) of the total.
For example, the under-18 share of the total population tended to be largest in counties in parts of Alaska, Texas (particularly along the Mexican border), and parts of the Midwest — all places where counties tend to have higher general fertility rates.
Higher proportions of the population ages 18-24 were often seen in counties with large universities or military bases.
The share of the population age 65 and older was largest in parts of the West, particularly in Arizona, Idaho, Nevada and along the coast of the Pacific Northwest. There were also some counties with high proportions of the 65-and-older population in Florida, Texas and along the East Coast.
Highlights
Age and Sex:
- The median age — the age at which half of the population is younger and half is older — continued to rise. The U.S. median age was 39.4 in July 2025, up from 39.2 in July 2024 and 38.6 in April 2020.
- Females had a higher median age than males (40.7 vs. 38.1) in 2025, and the gap between them (2.55 years) increased slightly each year from 2.39 years in 2020.
- Maine had the highest median age in 2025 (44.9), while Utah had the lowest (32.6).
- The median age across all counties ranged from 22.1 to 70.1, and 75% of counties (2,360 of 3,144) had a median age at or above the median for the nation.
- Women outnumbered men by 6.3 million in 2025, making up 50.9% of the U.S. population. This pattern is particularly pronounced at older ages, where there are higher ratios of women to men, though the gap has been narrowing over time.
Technical Notes
The Population Estimates Program uses current data on births, deaths and migration to calculate population change since the most recent decennial census (2020 Census) and produce an annual time series of population estimates. Today’s release includes population estimates by age, sex, race and Hispanic origin for the nation, states, metropolitan and micropolitan statistical areas, and counties, and population estimates by age and sex for Puerto Rico Commonwealth and its municipios. Beyond the specific age groups highlighted above, the full release includes median age, select age groups, and single years of age. Tables are available on census.gov/popest.
This is the final release of the Vintage 2025 Population Estimates. The Census Bureau previously released total population estimates for the nation, states and Puerto Rico Commonwealth; metropolitan and micropolitan statistical areas; counties and Puerto Rico municipios; and incorporated places and minor civil divisions. Components of population change and housing unit estimates for the nation, states and counties are also available on the Population and Housing Unit Estimates webpage.
The full release schedule for the Population Estimates Program can be found on the Census Bureau’s website.
Vintage 2025 incorporates the 2020 Census by full demographic detail (age, sex, race and Hispanic origin) into the April 1, 2020, estimates base for the first time.
With each new release of annual estimates, the entire time series of estimates is revised for all years back to the date of the last census. All previously published estimates (i.e., old vintages) are superseded and archived on the FTP2 site. Due to periodic methodological updates, year-to-year comparisons in the estimates should only be made within the same vintage.