


Texas Border Business


By Arnoldo Mata
On the surface, the Rio Grande Valley population continues to grow. However, compared to previous decades, the pace of growth appears to be slowing down. The region’s year-to-year growth slowed from a robust 2.28% in 2011 to a paltry 0.62% in 2018. Overall, all four counties are seeing declining growth rates with one county losing population and another on the verge of starting to lose population.
THE DATA


The Rio Grande Valley is the four-county region that includes Cameron, Hidalgo, Starr and Willacy counties along the Texas-Mexico border region. The data for this report comes from the U.S. Census Bureau.
The region’s history of growth was steady for 30 years from 1980 through 2010, with a particularly robust growth rate from 1990-2010. As Graph 1 shows, the entire Rio Grande Valley grew at a steady pace through 2010.
The RGV had an almost 40% growth rate during the 1990-2000 period. All four counties saw significant growth. Hidalgo almost hit 50% (48.47%) during the same period. It was during this period that Hidalgo County was listed as one of the fastest growing metro areas in the country. From 1980 to 1990, Starr county also saw an almost 50% (48.60%) increase.
Willacy grew at a much slower pace than the rest of the region. The county had its highest growth rate of 13.43% from 1990-2000. Willacy is the slowest growing county in the region. It also has the smallest population.
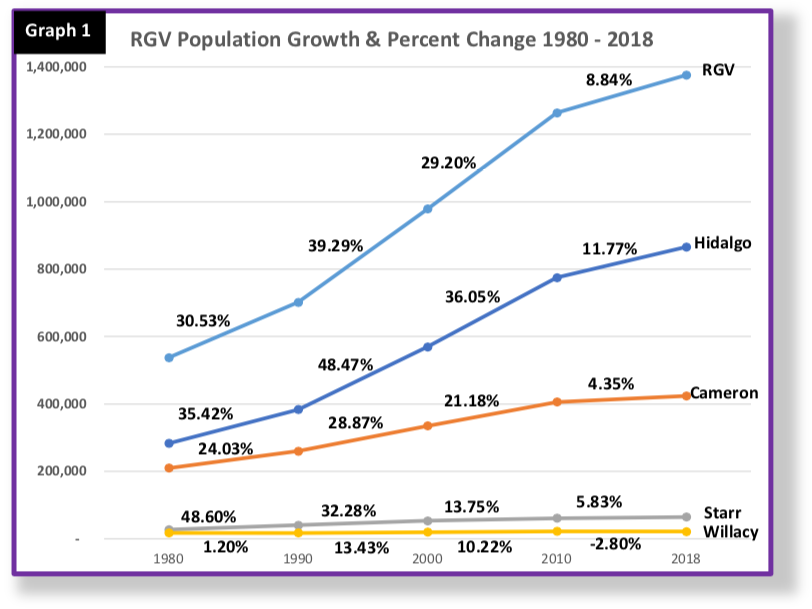
During the current decade, however, that growth seems to have tempered. As Graph 1 shows, the post-2010 growth is slower than during the previous three decades. The slowdown is more pronounced once the 2010-2018 period is examined more closely.
Looking at U.S. Census Bureau population estimates from 2010 to 2018, the data points to continued growth over the 8-year period but a slowing trend as well. As Graph 2 indicates, the RGV grew from 1,264,091 to 1,375,887 between 2010 and 2018. Hidalgo County grew from 774,769 to 865,939 during the same period. Cameron grew from 406,220 to 423,908, and Starr went from 60,969 to 64,525. Willacy saw a drop from 22,134 to 21,515.
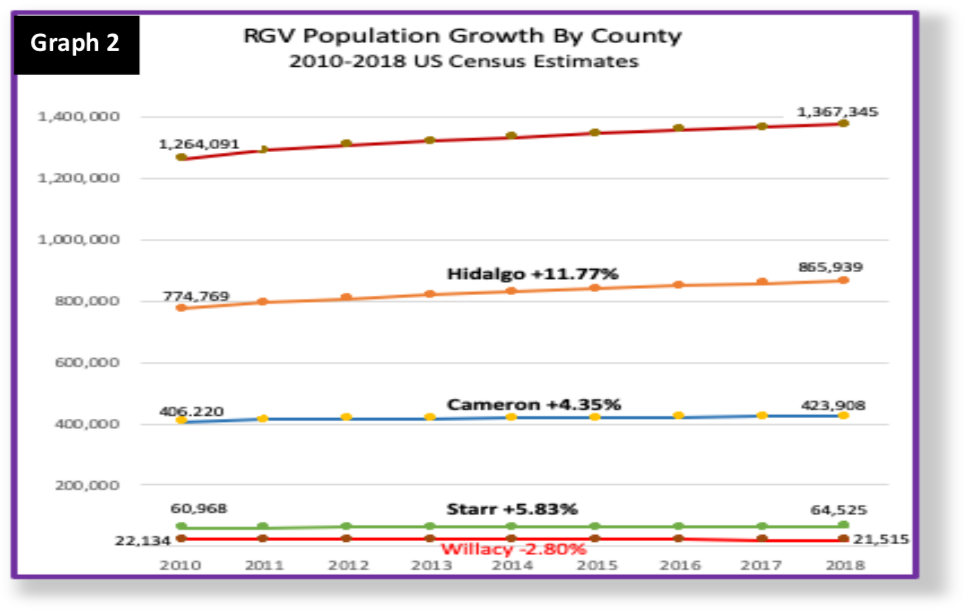
The RGV had a respectable 8.84% growth rate over the eight years. Hidalgo County, however, had an even more impressive 11.77% rate of population growth during the same period. Cameron and Starr also showed increases at 4.35% and 5.83%, respectively. Willacy County, on the other hand, has been steadily losing population since 2013 for an overall growth rate of negative 2.80%.
To provide some context, it is worth noting that Texas had a 14.14% growth rate from 2010 to 2018 while the United States had a 5.9% growth rate during the same period. As such, the overall RGV growth rate is still strong in comparison to the state and national rates.
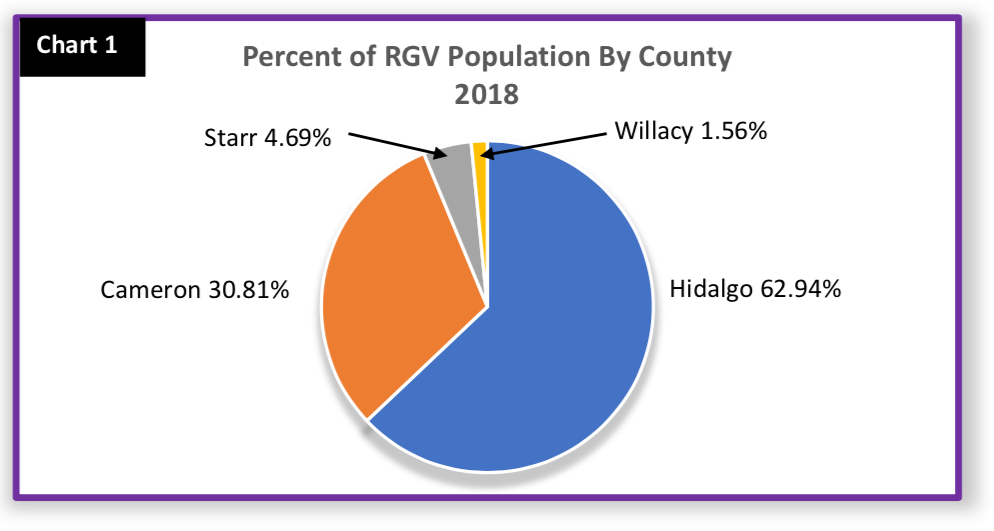
Hidalgo County continues to drive growth in the RGV. As Chart 1 indicates, Hidalgo County comprised 62.94%, or almost two-thirds, of the RGV population in 2018 while Cameron comprised 30.81%. Starr accounted for 4.69% and Willacy for 1.56%, respectively.
Graph 3 provides a visual representation of how growth across the region is starting to slow down during the 2010-2018 period.
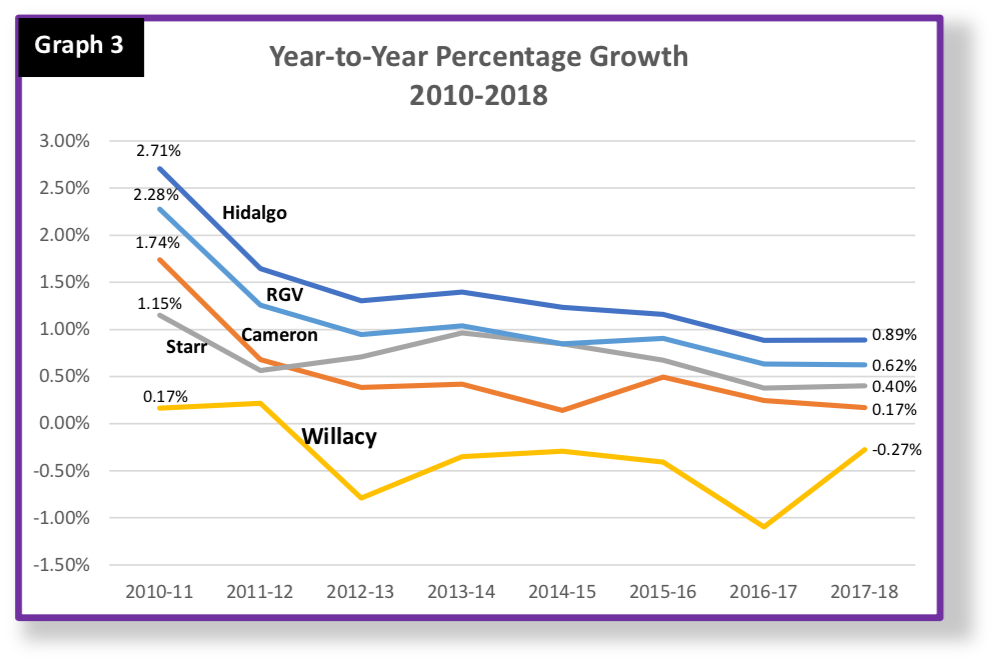
All four counites are experiencing a slowdown in growth. By the end of this period, all four counties were at less than 1.0% annual growth. Looking at year-to-year comparisons, Hidalgo went from an annual rate of 2.71% growth to 0.89% during the eight-year period. Likewise, the RGV went from 2.28% to 0.62%. Cameron went from 1.74% to 0.17% while Starr went from 1.15% to 0.40%. Willacy started experiencing negative growth in 2013, losing population at a rate of 0.79%. This loss of population continues to the present.
As Table 1 shows, from 2017 to 2018, the slowdown in growth seems to have started to level out in the region. The RGV was at 0.90% growth from 2015 to 2016 but then dropped even more to 0.63% from 2016 to 2017. From 2017 to 2018, the drop slowed to just 0.62%. Starr and Willacy also saw similar changes. During 2017-2018, Starr went from 0.38% to 0.40% while Willacy went from negative 1.10% to negative 0.27%. This last change for Willacy represents a slowdown in its population loss. It does not necessarily mean that Willacy is on the way to increasing its population.
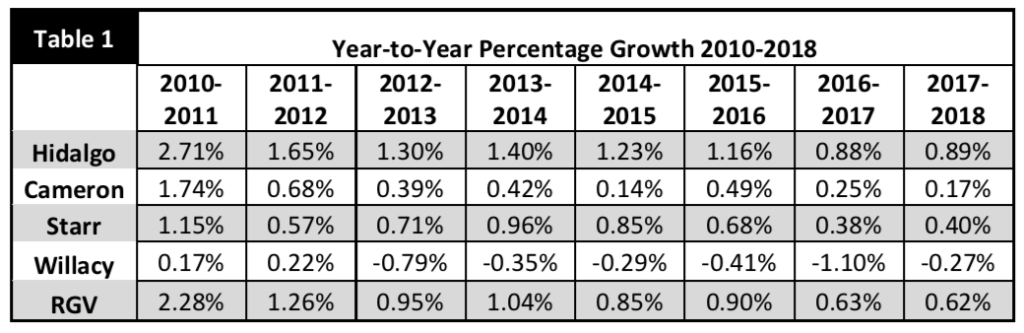
Cameron’s growth rate continues a downward trend through the entire 2010-2018 period. The last three years highlight how Cameron’s slowing growth is particularly striking. The county added 2,079 people from 2015 to 2016; 1,004 from 2016 to 2017; and just 727 from 2017 to 2018. As Table 1 indicates, this amounted to a growth rate of just 0.17% from 2017 to 2018. If Cameron county’s growth rate continues at the same rate, the county will start to lose population within three-to-five years.
THE IMPACT
The region’s rate of growth is a critical element of concern for local communities. The most immediate concern is the economic impact. If the population growth continues to slow down, it would make the area less marketable to companies and industries seeking to locate into the region. A thriving, growing environment is attractive to such companies. It also points to the potential drop in the workforce.
Another concern is the impact of population changes on funding. For example, some federal funding, such as the Community Development Block Grant program, is apportioned, in part, based on population.
Congressional seats are also decided by population. An area with declining population may lose the number of Congressional seats assigned to that area. The same applies to state representative and senate seats. These factors certainly impact a region’s political strength at the state capital and in Washington, D. C.
Local governments are also impacted by population changes. For example, local government tax revenues are affected by residential, commercial and industrial construction and development. An area that experiences population declines will see less construction and development. This has the potential to reduce the tax base by depressing property values as there is less demand for housing and other types of property. As a result, local governments are faced with either lower revenues or increasing the tax rate, or a combination of both.
Still, the coming 2020 Census will do much to provide a more accurate count and assessment of population changes. This is one of the main reasons local governments have a major stake in ensuring that the Census Bureau provides a complete count. Additionally, it also points to the need for local governments to encourage residents to actively participate in the Census Bureau’s count.
Population changes are affected by four factors: deaths, births, out-migration and in-migration. In-migration is fed by people moving into the county from other parts of the state or other states and from outside the country. In a future report, RGVData.com will explore these factors as they apply to the region and individual counties where data is available.
Some of the data used in this report is the yearly estimates provided by the U.S. Census Bureau based on surveys of selected households. It is not based on a detailed population count. The Bureau acknowledges that there is a margin of error in the estimates. Other data is sourced from the decennial census, which represents a more complete count of the population.
While the available data point to declining growth patterns, there is the possibility that the available data is flawed or not sufficient to accurately predict population changes in the last eight years. However, Census Bureau population estimates have proven fairly accurate in the past.