


Texas Border Business

Texas Border Business
The image published with this article shows the U.S. Debt Clock, a real-time display that tracks federal financial data using publicly available sources. The figures shown are current as of December 17, 2025. The clock updates continuously and provides estimates of national debt, spending, revenue, and other budget measures.
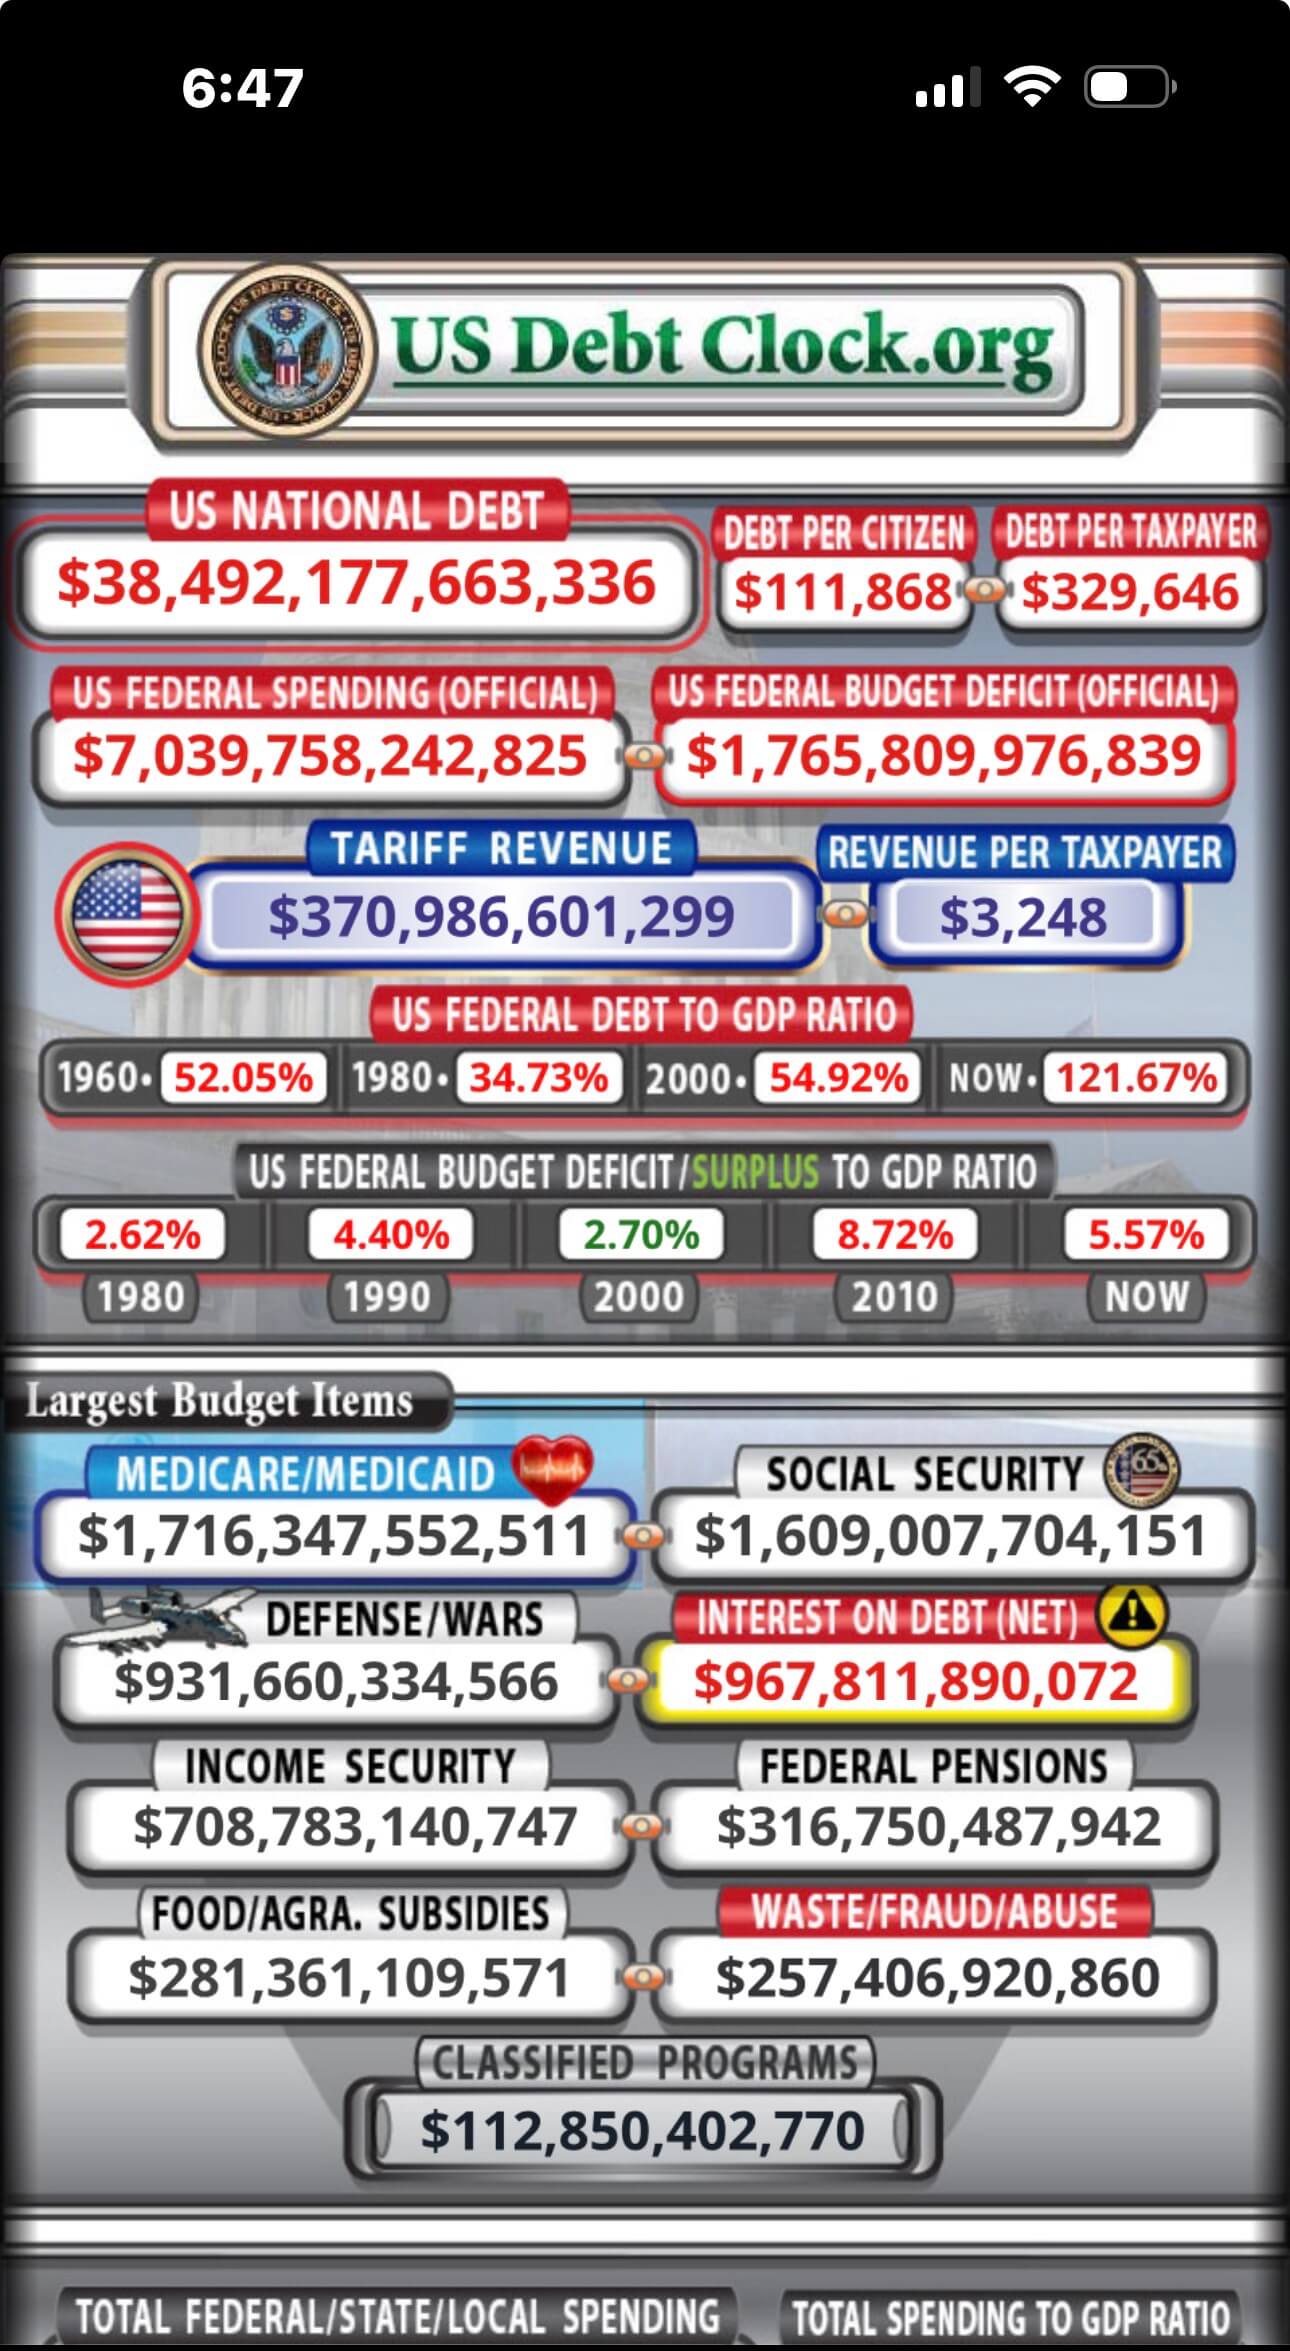
According to the image, the U.S. national debt is shown at $38,492,177,663,336. To help readers understand the scale, the clock also estimates the debt per person at $111,868 and the debt per taxpayer at $329,646. These numbers are not bills sent to individuals. They are estimates used to show how large the debt is when spread across the population.

The image lists total federal spending at $7,039,758,242,825. It shows the federal budget deficit at $1,765,809,976,839. The deficit represents the difference between how much the federal government spends and how much it collects in revenue.
One section of the image highlights tariff revenue. It shows tariffs totaling $370,986,601,299, with an estimated $3,248 per taxpayer. Tariffs are taxes on imported goods and are one source of federal income.
The image also compares federal debt to the size of the U.S. economy. It shows the current debt-to-GDP ratio at 121.67 percent. For comparison, the clock lists the ratio at 52.05 percent in 1960, 34.73 percent in 1980, and 54.92 percent in 2000. These figures show that federal debt has grown much faster than the overall economy over time.
Another part of the image shows the federal budget deficit as a share of the economy. It lists 2.62 percent in 1980, 4.40 percent in 1990, 2.70 percent in 2000, 8.72 percent in 2010, and 5.57 percent today. These numbers indicate that recent deficits remain higher than in many past decades.
The largest section of the image focuses on major spending programs. Medicare and Medicaid are listed at $1,716,347,552,511. Social Security is shown at $1,609,007,704,151. Defense and war-related spending is listed at $931,660,334,566. Net interest on the national debt is shown at $967,811,890,072, reflecting the cost of paying interest on existing debt.
Other spending categories include income security at $708,783,140,747, federal pensions at $316,750,487,942, food and agriculture subsidies at $281,361,109,571, and waste, fraud, and abuse estimated at $257,406,920,860. The image also lists classified programs totaling $112,850,402,770, with no further details.
Taken together, the numbers on the U.S. Debt Clock provide a snapshot of federal finances as of December 17, 2025. The image does not explain why these numbers exist or how policies affect them. It simply presents estimates that show the size of government spending, borrowing, and debt at a specific moment in time.
The U.S. Debt Clock can be found at usdebtclock.org. The website is free and open to the public. It displays real-time estimates of national debt, federal spending, tax revenue, and related financial data. Because the figures update every second, the numbers shown are estimates rather than final audited totals.