


Texas A&M University • Texas Real Estate Research Center


By Luis B. Torres, Wesley Miller, Jacob Straus, and Brendan Harrison
September 2021
Indicators along the Texas-Mexico border pointed toward continued economic progress in third quarter 2021 amid healthy consumer spending and solid employment growth. Payrolls expanded on a quarterly basis, but a late surge in weekly initial unemployment claims suggests hiring may slow at the start of the fourth quarter. Construction activity accelerated while pricing pressures persisted in the manufacturing sector as supply-chain disruptions continued and, thus, hampered trade values. Housing sales declined, but the average days on market indicated robust demand. Depleted supply and accelerating home prices threaten housing affordability in an environment of lagging real wage growth and represent the major headwinds to the region’s housing market and the economy in general.


Economy
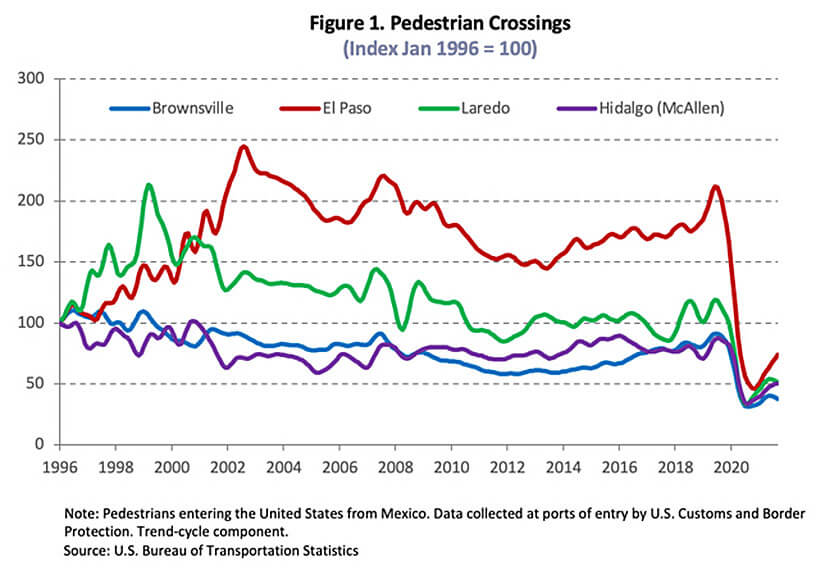
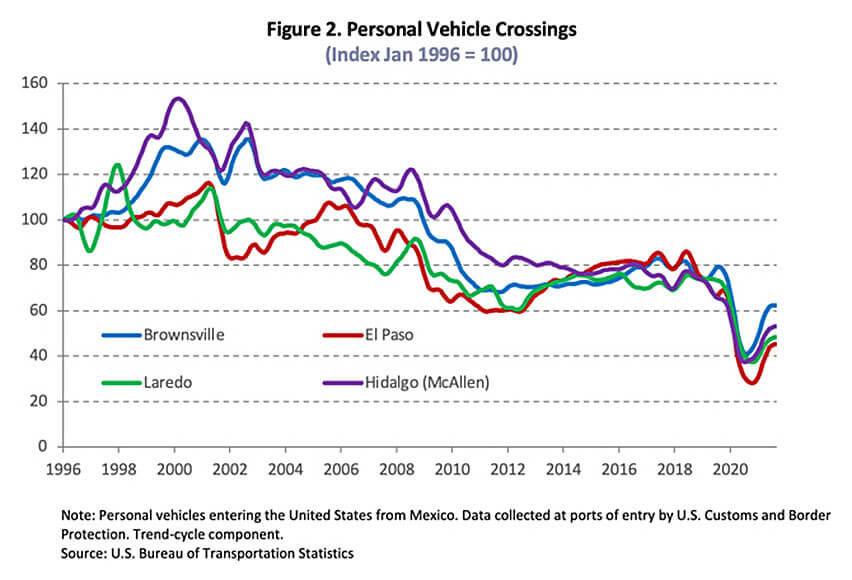
The economic recovery resumed along the border in September as indicated by the Dallas Fed’s Business-Cycle Indexes. The metric in El Paso and McAllen increased 5.4 and 21.2 percent, respectively, on a seasonally adjusted annualized rate (SAAR) with solid payroll expansions. The indexes in Laredo and Brownsville both elevated 7.6 percent despite a reduction in real wages. The U.S. lifted its ban on nonessential travel on Nov. 8, 2021, which should boost activity in leisure/hospitality employment and retail sales. Certain measures, however, were reestablished per a presidential proclamation several weeks later due to the emergence of the Omicron variant. Pedestrian and personal vehicle crossings from Mexico increased in September as border travel trended upward, growing nearly 25 percent above year-ago levels (Figures 1 and 2).
Border nonfarm employment added 13,900 jobs, resulting in SAAR growth of 7.6 percent. McAllen led the border with employment increasing by 7,800 workers with broad hiring across the service-providing sector. Brownsville and El Paso recovered a net 1,600 and 3,400 positions, respectively, while Laredo expanded payrolls by 1,100 employees.
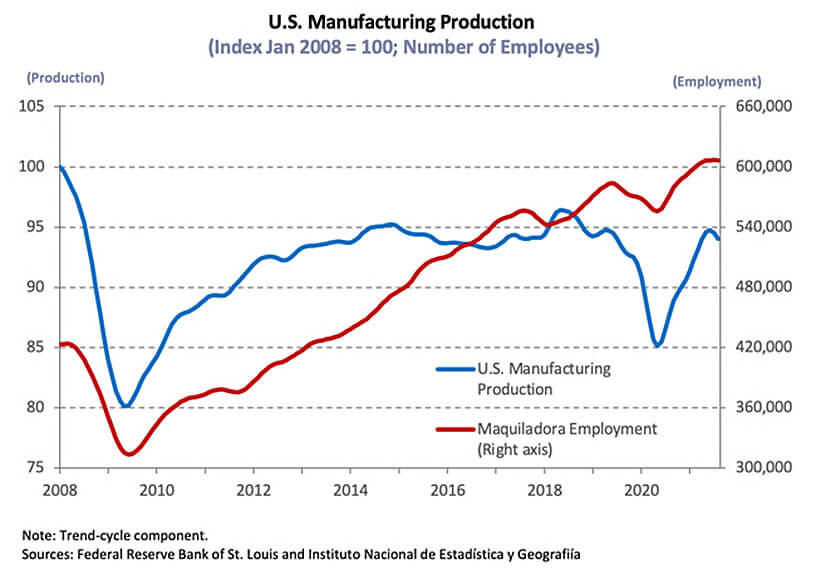
On the southern side of the border, Mexican manufacturing and maquiladora employment1 decreased in August for the second consecutive month, laying off 20,860 workers. Year-to-date (YTD) payrolls accelerated in Reynosa and Chihuahua but flattened on a monthly basis, adding only 115 and 70 workers, respectively. Matamoros employment rebounded 1.3 percent YTD after shedding 760 workers in July. On the other hand, maquiladora employment decreased 4.5 percent in Juarez and decelerated to 1 percent YTD in Nuevo Laredo, losing over 23,000 workers in the former and 840 workers in the latter during August. During ongoing supply chain issues, U.S. manufacturing production of motor vehicles continued its decline into September after a strong summer. The IHS Markit Mexico Manufacturing Purchasing Managers’ Index extended its streak in negative territory to more than 19 months as the pandemic and weather-related closures negatively impacted output. In addition to supply-side challenges, a decline in new orders indicated softened demand, causing employers to reduce payrolls in an attempt to lower costs. The pandemic and the Mexican government’s response to the virus remain significant factors concerning the country’s future growth and trade with Texas’ border economies.
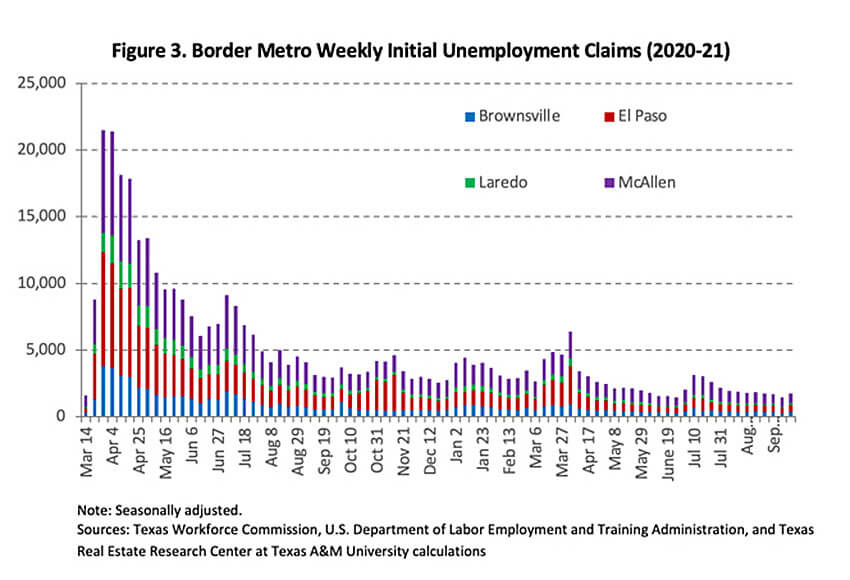
Hiring in the Rio Grande Valley pulled unemployment rates down to 8.4 and 8.7 percent in Brownsville and McAllen, respectively, during an expansion in local labor forces. Joblessness declined in both El Paso and Laredo, falling to 5.9 and 6 percent, respectively, as labor forces expanded in both metros. Weekly initial unemployment claims rose sharply in the last week of September during an influx of new COVID-19 cases, reflecting the statewide trend after a three-month decline (Figure 3).
Fluctuations in average private hourly earnings revealed lackluster wage growth along the border except in El Paso, where annual wage growth turned positive in September. Some of the downward pressure may be due to the recovery of lower-paying jobs that bore the brunt of the layoffs last spring, pulling the average wage down. In addition, the inflationary environment prevented meaningful gains in purchasing power. Earnings in McAllen fell 4.9 percent year over year (YOY) in real terms to a nominal wage of $19.38, marking the 13th straight annual decline. Hourly wages in Laredo ($17.53) decreased 10.9 percent and remained unchanged in Brownsville ($17.40) relative to year-ago levels, while El Paso’s metric increased to $20.86. While baseline effects mechanically weighed on YOY numbers, annual wage growth trended below pre-pandemic levels across the border.
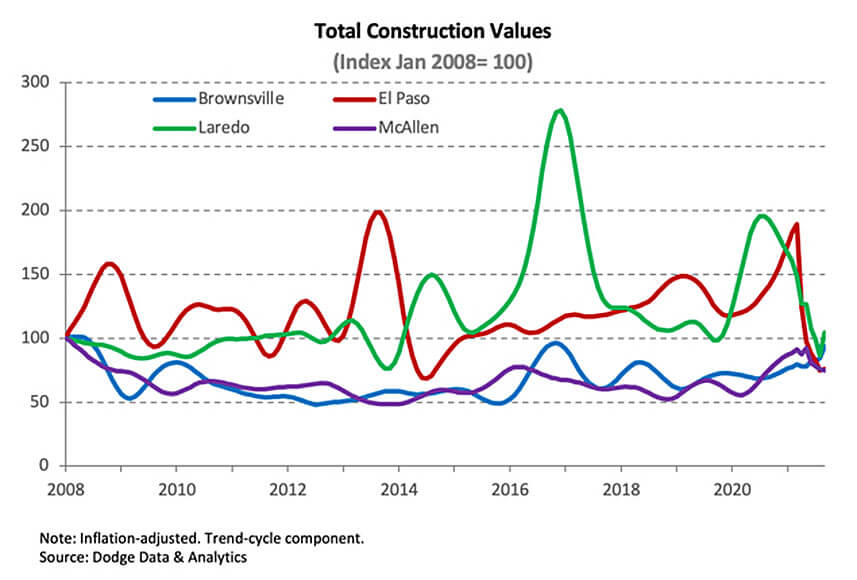
Total construction values accelerated along the border, increasing 17.4 percent during the third quarter. Various nonresidential sectors expanded in El Paso, Brownsville, and Laredo, offsetting decreased investment in McAllen. On the residential side, values declined in El Paso and McAllen while expanding in Laredo and Brownsville with significant increases in single-family activity.
In the currency market, the peso per dollar exchange rate ticked up to 20.05 after the inflation-adjusted rate2 decreased 6.3 percent YOY, revealing domestic goods were relatively cheap to Mexican buyers in real terms. Despite currency fluctuations, both imports and exports declined due to several COVID-19 outbreaks and continued supply-chain bottlenecks, pulling total trade values in the border hubs down 2.3 percent after strong growth in the previous quarter. At the metropolitan level, exports slightly declined over the past three months, while imports fell 2.3 percent due to reduced activity in McAllen and Laredo despite double-digit growth in Brownsville. Total trade values, however, surpassed pre-pandemic levels except in El Paso, where activity remained down 66 percent because of ongoing disruptions to global supply chains. The border’s trade sector remains an integral component of the local economies.
Housing
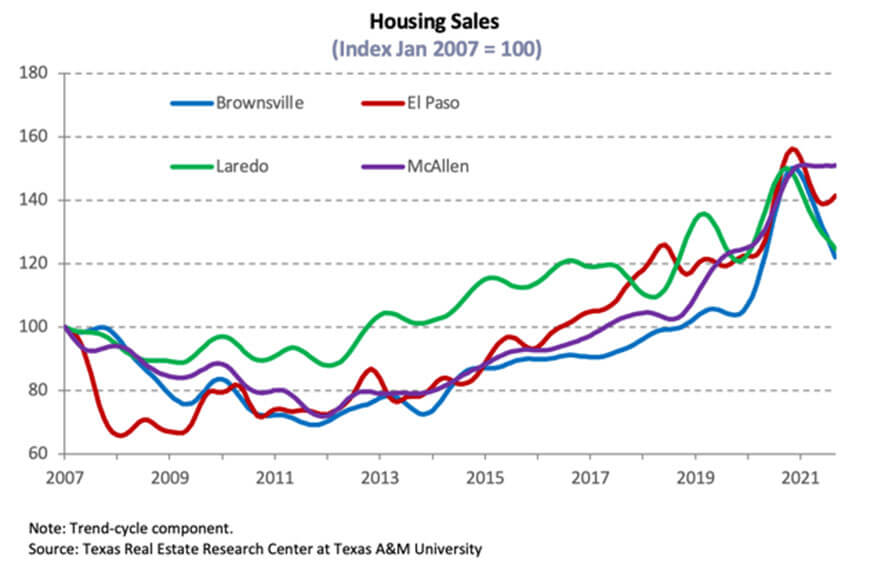
Although border housing sales turned negative in September, the strong growth posted in August resulted in a 1.5 percent quarterly increase despite ongoing inventory constraints and reduced housing affordability. Activity in the Rio Grande Valley varied as sales fell 5.6 percent in Brownsville but elevated 2 percent in McAllen, mostly due to greater transactions for homes priced more than $300,000. In El Paso, sales rebounded 1.7 percent, trending upward due to increased activity for homes priced less than $300,000. Meanwhile, Laredo sales accelerated for the second straight quarter, increasing 2.7 percent.
The border metros issued 2,175 single-family housing construction permits, decreasing 17.6 percent after positive growth during the previous quarter. Issuance trended downward at the metropolitan level, falling 13.7 and 15.6 percent in Brownsville and McAllen, respectively. El Paso and Laredo also reported double-digit reductions in permits, declining 19.8 percent in the former and 13.7 percent in the latter. On the other hand, private single-family construction valuesincreased along the border except in McAllen, where values decreased 8.1 percent.Despite the third-quarter surge, all border metros maintained a downward trend in values except Brownsville, where the metric ticked up and suggesting steady building in the coming months.
Moderate sales activity and an increase in additional listings during September pushed months of inventory (MOI) up to 2.5 and 1.3 months in McAllen and El Paso, respectively. Laredo’s metric remained unchanged at 1.9 months, while Brownsville inventory expanded to 1.8 months, slightly more than the statewide average (1.6 months). A balanced housing market typically has an MOI closer to six months.
The average number of days on market (DOM) along the border continued to decline, corroborating robust demand despite the YTD dip in sales. The DOM in El Paso decreased to 36 days, while Laredo’s fell to 37. McAllen and Brownsville both reached all-time lows, dropping to 49 and 45 days, respectively.
While the shift in sales toward higher-priced homes due to limited inventories at the lower end of the market slowed in September, compositional changes contributed to quarterly increases in the median home price along the border. Brownsville’s median price was up 1.2 percent over the second quarter, pushing the median price to $224,000. Laredo’s ($210,200) and McAllen’s ($212,400) median home prices accelerated, rising 3.9 and 5.5 percent, respectively. El Paso’s $200,800 median decelerated to 3.6 percent. Annual changes in quarterly home values, however, were more indicative of the recent price growth as the El Paso Repeat Sales Home Price Index accelerated 14.6 percent relative to 3Q2020.
Lower-priced housing in the border metros generally reflects below-average earnings statewide, thereby managing affordability pressures as measured by the Texas Real Estate Research Center’s Affordability Indexes. Recent home-price appreciation, however, dampened affordability, particularly in Brownsville, where the affordability-metric decreased for the third consecutive quarter to 1.20; this indicates a family earning the metro median income could afford a home priced 20 percent more than the median sale price. The McAllen and El Paso indexes also fell substantially to 1.39 and 1.49, respectively, relative to year-ago levels. Laredo’s metric ticked down to 1.60. The trend declined across the border, weakening the housing affordability advantage that has supported the region’s attractiveness compared with other parts of the state.
____________________
1 Mexican manufacturing and maquiladora employment data are generated by the Instituto Nacional de Estadística y Geografía. Its release typically lags the Texas Border Economy by one month.
2 The real peso per dollar exchange rate is inflation adjusted using the Texas Trade-Weighted Value of the Dollar. Its release typically lags the Texas Border Economy by one month.